
I have always said that an uncertain and volatile market is the absolute worst. Yes...even worse than a bear market.
That’s because with a bear market there is a clear trend that you can lean into. Such as buying inverse ETFs to make money as the market declines.
But a volatile range bound market, such as this one, is just a pure headache for investors. Many of whom are just giving up as can be seen in many metrics of stock research activity and trading volumes.
The key is understanding the nature of the current volatility and what likely comes on the other side. Appreciating that is the best way to align your portfolio now for gains in the weeks and months ahead. That will be our focus today.
Market Commentary
First, the stock rally up to 4,600 for the S&P 500 (SPY) in late July was just too high given the muted earnings growth thanks to the Fed’s hawkish policies to bring inflation back to the 2% target. So that was a natural time for a round of profit taking and sector rotation before the next leg higher.
But just as stocks looked ready to bounce...bond rates started to explode higher. Not because of the Fed as they haven’t raised rates in a while. Rather because of other dynamics at play that we will simply describe as Rate Normalization. (More on that topic in this commentary).
This dynamic has led to the unattractively volatile, range bound market you see in the 3 month chart below:
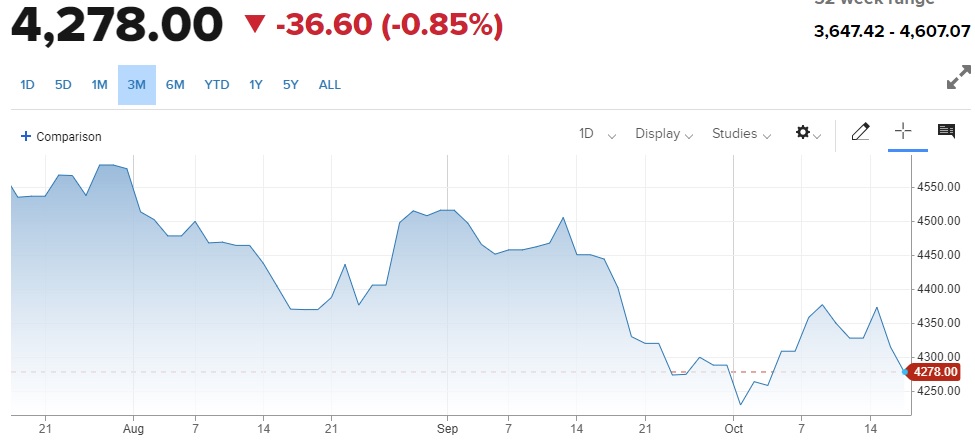
Yes, one could say this is a case of lower highs and lower lows. And thus potentially a bearish signal.
However, with the S&P 500 still above the 200 day moving average and 20% above the previous bear market low...then technically still bullish.
The reason I am not particularly concerned about more downside is because of the current strength of the economy. Sure, you can parade out a statistic here or there that shows weakness. That is why we are going to discuss the broadest measure of health...that being GDP.
The GDPNow model from the Atlanta Fed stands at +5.4% for Q3 whereas the Blue Chip Economist Consensus at 3.5% (likely more on target). We will know for sure next Thursday 10/26. Pardon me but there is just no way to look at these respected estimates and feel bearish.
Perhaps even more important than the GDP report next week is the PCE Inflation reading that gets released along side of GDP. As the Fed has stated many times over their reading of Core PCE is their preferred method of reading the state of inflation. That is expected to drop from 3.7% to 3.1% which is moving ever closer to the 2% target of the Fed.
The above explains why investors are now 92% sure the Fed will hold rate steady for a second straight meeting on November 1st. Note that a month ago there was over a 30% expectation of a rate hike on the way in November.
This all seems to fly in the face of the recent discussions of higher bond rates disrupting the stock market. I talked about that in great detail in my last commentary.
Warning: Investors Prepare for “Sea Change”
The basic story is that rates were artificially suppressed by the Fed. So as their policies changed, with less manipulation to lower rates, then rates are rising higher. What really is a normalization of rates which resets the bond vs. stock investing equation.
My sense is that 5% on the 10 year Treasury (which we are touching now) will be a point of resistance for investors. Most certainly will touch it...probably a smidge higher...then things consolidate around or even under 5% for a while. If true, then less reason to hit the sell button for stocks especially with the economy looking so robust at this time.
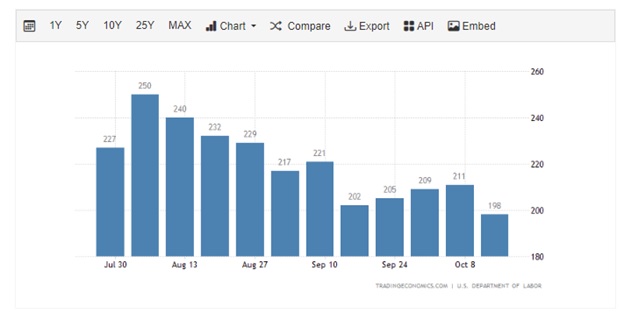
Most people are waiting for employment picture to finally buckle as a sign the economy is ready for a downturn. However, the best forward looking indicator or the unemployment rate is the weekly Jobless Claims report. The closer that gets to 300K...the more likely that the unemployment rate is ready to rise. However, as you will see in the chart below this indicator is actually getting healthier. That includes Thursdays dip under 200K.
So if there is no recession on the horizon. And investors are just adjusting to this Rate Normalization, then there may indeed more volatility ahead. But beyond that phase most signs point bullish.
WHEN do we emerge into that next bull run higher?
Unknown and unknowable at this time. Yet I sense that once investors see rates level out or pull back...then stocks will be back in fashion once again.
DO NOT EXPECT a roaring bull market. Higher rates will lead to a lower earnings growth environment which mutes stock returns. Gladly those with an advantage will be able to easily top the modest returns of the S&P 500.
Yes, we have such an advantage with our POWR Ratings. More on those top picks in the next section...
What To Do Next?
Discover my current portfolio of 7 stocks packed to the brim with the outperforming benefits found in our POWR Ratings model.
Plus I have added 5 ETFs that are all in sectors well positioned to outpace the market in the weeks and months ahead.
This is all based on my 43 years of investing experience seeing bull markets...bear markets...and everything between.
If you are curious to learn more, and want to see these 12 hand selected trades, then please click the link below to get started now.
Steve Reitmeister’s Trading Plan & Top Picks >
Wishing you a world of investment success!

Steve Reitmeister…but everyone calls me Reity (pronounced “Righty”)
CEO, StockNews.com and Editor, Reitmeister Total Return
SPY shares were trading at $423.52 per share on Friday morning, down $2.91 (-0.68%). Year-to-date, SPY has gained 11.97%, versus a % rise in the benchmark S&P 500 index during the same period.
About the Author: Steve Reitmeister

Steve is better known to the StockNews audience as “Reity”. Not only is he the CEO of the firm, but he also shares his 40 years of investment experience in the Reitmeister Total Return portfolio. Learn more about Reity’s background, along with links to his most recent articles and stock picks.
The post The Worst Stock Market Ever? appeared first on StockNews.com