In last week’s commentary I focused on the following relationship:
Rates Up > Stocks Down
Now everyone is quite aware of this dynamic explaining the continued pressure on stock prices with the S&P 500 (SPY) at the lowest level in months.
However, what remains unclear to most is... WHY it this happening...and how much higher could rates go?
That will be the focus of this week’s Reitmeister Total Return commentary.
Market Commentary
The best place to start our conversation is with this 1 month chart showing the rise of the 10 Year Treasury rate vs. the decline of the
The reason for higher long term bond rates is quite simple...and actually has nothing to do with current inflation issues which are likely to fully moderate in the coming 12-24 months. What this boils down to is the following term that you will see more and more:
Rate Normalization
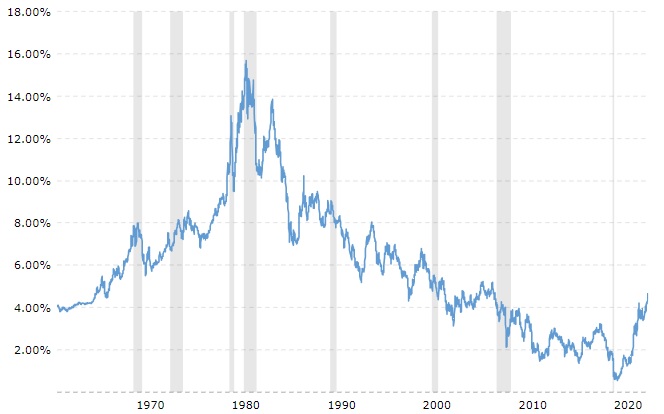
Meaning that rates have been “abnormal” ever since the Great Recession as the Fed used every tool imaginable to crush interest rates to reinvigorate the economy. The ante got upped during Covid with rates tumbling down to a historic low of 0.5% for the 10 year Treasury.
Let’s review this 60 year chart to appreciate the trends over the years:

There really have been 2 abnormal periods in history. We just spoke about rates tumbling to all time lows after the Great Recession through Covid (2008-2020).
Now check out the spike in rates during the hyper-inflation period of the late 1970’s. This peaked in 1982 thanks to the hard work of then Fed Chair Volker.
So what are normal rates for the 10 year Treasury?
There is some debate, but most say 4.5% to 5%.
Where are we today? Smack dab in the middle at 4.79%.
Yes, that is much higher than recent memory...but not really high in the grand scheme of history. And thus not necessarily a reason for the economy to come to a screeching halt and thus not a reason to flee stocks in the long run.
Yet in the short run, some adjustments to investment portfolios have to be made. For example, with yields this high we all can get a decent rate of return with bonds and money market accounts without taking any real risk. This is having more money flowing out of stocks towards bonds.
That is not a brand new phenomena as bond fund flows have been very positive since late 2022. The greater question now is when will we hit peak rates...and thus when will the stock market carnage end?
If you line up 10 investment experts, they will give you 10 different opinions. Because to be honest, 90% of them didn’t really see this coming. And thus cant give a straight answer on how/when it ends.
That is why I thought valuable to draw back to the picture of the historical rates. When you remove the abnormal highs and lows you find that we are pretty close to normal. So, it is fair to imagine that 5% could present a reasonable near term top for rates.
Unfortunately...who says that the market is rational?
The bond market gets hit with waves of fear and greed just like the stock market. And thus we could easily go well past 5% bond rates before things correct back to normal levels. And yes, that would be bad for stock prices.
Truly we are at a critical juncture. Not just about the direction of bond rates, but also stocks are on closing in on the most important technical level. More on that in the next section.
Price Action & Trading Plan

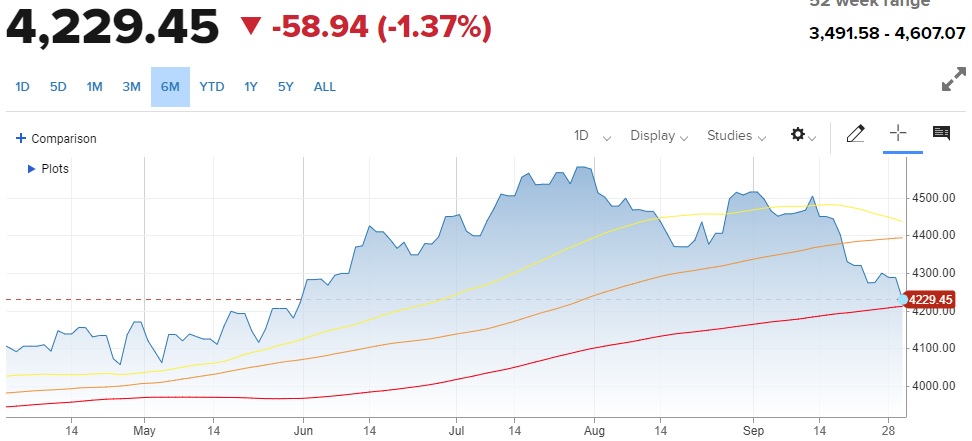
Moving Averages: 50 Day (yellow), 100 Day (orange), 200 Day (red)
There is no way to paint this picture in a positive light. As you can see, this past month stocks have broken down past support at the 50 day and 100 day moving averages. So obviously now we are all wondering how well the 200 day moving average will hold up at 4,202.
Personally, I like the odds of seeing solid short term support at this level. BUT if the 10 year Treasury rates start raging above 5%...then I suspect stocks will spend some time below the long term trend line only adding to recent negativity.
As for our trading strategy, we are 100% invested and have taken advantage of the recent dip to add stocks & ETFs that should excel when a bounce finally ensues. But a serious break below the 200 day moving average would have me consider more conservative measures. Like perhaps retreating to 70-80% long.
Why not more conservative or even bearish?
Would need to see more serious reason to believe in a recession forming that would provide a fundamental reason for extended stock downside. OR a deeper break under the 200 day that would have to be heeded in our strategy.
Either one of these would have use getting less long stocks...and potentially buying inverse ETFs to profit from downside.
Hard to explain why...but I have little fear of that at this moment. And just sense a bounce should soon be in hand with the picks in our portfolio leading the parade higher.
What To Do Next?
Discover my brand new “2024 Stock Market Outlook” covering:
- Bear Case vs. Bull Case
- Trading Plan to Outperform
- What Industries Are Hot...Which Are Not?
- Top 11 Picks for the Year Ahead
- And Much More!
Gain access to this vital presentation now by clicking below:
Wishing you a world of investment success!

Steve Reitmeister…but everyone calls me Reity (pronounced “Righty”)
CEO, StockNews.com and Editor, Reitmeister Total Return
SPY shares . Year-to-date, SPY has gained 11.46%, versus a % rise in the benchmark S&P 500 index during the same period.
About the Author: Steve Reitmeister

Steve is better known to the StockNews audience as “Reity”. Not only is he the CEO of the firm, but he also shares his 40 years of investment experience in the Reitmeister Total Return portfolio. Learn more about Reity’s background, along with links to his most recent articles and stock picks.
The post When is the Stock Bounce Coming? appeared first on StockNews.com