

But with the right tools and resources, any investor or financial analyst can understand and use the data to their advantage. In this article, we'll explore the various methods for how to calculate stock growth rates and how you can use the information to make informed investment decisions.
How Investing Works
Investing in the stock market is a common way to grow and diversify your financial portfolio. It can be a great way to increase your wealth, but it's important to understand how the stock market works before you dive in. At its most basic level, when you buy or sell stocks, you are buying small pieces of ownership in companies listed on an exchange such as the New York Stock Exchange (NYSE) or NASDAQ.
The company will then use the money they receive from your purchase and those of other investors to fund new projects or expand their business. When they do this successfully, their share price will rise, and you can then make a profit if and when you sell the stock. Investing in stocks can yield high returns if you do it strategically; however, there is also a large element of risk associated due to changes in market conditions and economic trends, which can quickly cause prices to drop dramatically.
What Are Stock Growth Rates?
Stock Growth Rate Formula
Linear returns are simpler to calculate and involve subtracting the beginning stock price from the ending stock price and dividing by the beginning stock price. This method provides a more straightforward measure of a stock's percentage growth over time.
Using logarithmic returns via an estimated stock growth calculator can provide a more accurate picture of a stock's overall growth over time and is often used by financial analysts. Unlike linear return scales, they show percentage points instead of dollar amounts.
For a more accurate picture of the growth of your investment using a stock portfolio growth calculator, use the compound annual growth rate (CAGR), a metric used to measure the average rate of return for an investment over a specified period. It considers the gains and losses that occur during that period, allowing you to see how well your investments have grown.
Total returns require more complex calculations, as they also consider dividend payments and other market events that could affect the stock price. By understanding these calculations, you can make more informed decisions about when to buy or sell stocks to maximize your returns.
Factors to Consider Before You Invest
Before investing in the stock market, be sure to consider several factors, such as:
- Risk tolerance: Knowing your level of risk tolerance is important. Some investors prefer higher-risk investments with the potential for greater returns, while others prefer lower-risk investments with steady returns.
- Investment goals: Having a clear investment goal will help you determine which stocks you should be investing in and how long-term or short-term your investments should be.
- Diversification: Diversifying your portfolio helps reduce the risks of certain stocks underperforming and allows you to spread out potential losses.
- Research: Thoroughly research stocks you're interested in before making any investments. This includes reading reports and financial statements, following news related to the industry and understanding stock analysis tools such as earnings per share (EPS) and price-to-earnings (P/E) ratios. The P/E ratio measures the stock's current market price relative to earnings per share (EPS). You calculate it by dividing the current market price by the last 12 months of reported earnings. In other words, a stock with a P/E ratio of 20 would mean that the stock would trade at 20 times its earnings, meaning that investors are willing to pay 20 times the company's earnings for one share of the stock.
- Timing: Timing can have an impact on stock prices, so it's a good idea to keep an eye on market conditions when buying or selling stocks.
- Taxes: Investing in the stock market can have tax implications, so ensure you understand how this could affect your bottom line before diving into the market.
How to Calculate Stock Growth
In addition, some investors may also calculate average growth rate over a period — such as quarterly or annually — using either linear or logarithmic methods, including CAGR.
Step 1: Determine beginning and ending prices.
Step 2: Calculate linear return.
Linear Return Percentage = [(S2 - S1)/S1] x 100%
This method provides a more straightforward measure of a single period's percentage growth over time.
Step 3: Calculate CAGR.
The CAGR is a measure of the growth rate of an investment over years expressed as a single number. Calculate it by taking the nth root of the total return, with "n" being the years you held the investment. This can be useful for comparing investments with different periods and returns, as it allows you to compare apples to apples.
For example, if you invested in stock A for 10 years and earned a total return of 200%, that would be equivalent to 20% per year on average over that 10-year period. However, if you had invested in Stock B for five years and earned a total return of 125%, that would be equivalent to 25% per year on average over those five years. While both investments saw similar total returns, they had very different CAGRs due to their differing holding periods.
Step 4: Consider additional factors.
While the above formulas can provide insight into a stock's growth over a given period, consider additional factors that may impact a stock's performance when calculating your exact returns. For example, macroeconomic events, market volatility and company-specific news can send stocks up or down. Be sure also to consider the company's financial health and future prospects, including possible catalysts for growth or risks that may impact the stock price.
Another factor to consider is the company's dividend policy. If it pays dividends, this can provide additional income for you as an investor and impact your total returns over time. Some investors may even use technical analysis to identify trends or signals in a stock's price chart, which they then use to make buy and sell decisions. You can view all this information on the top of a stock page on MarketBeat or by searching the site for news on a specific stock.
Step 5: Consider taxes.
Example of How to Calculate Stock Growth
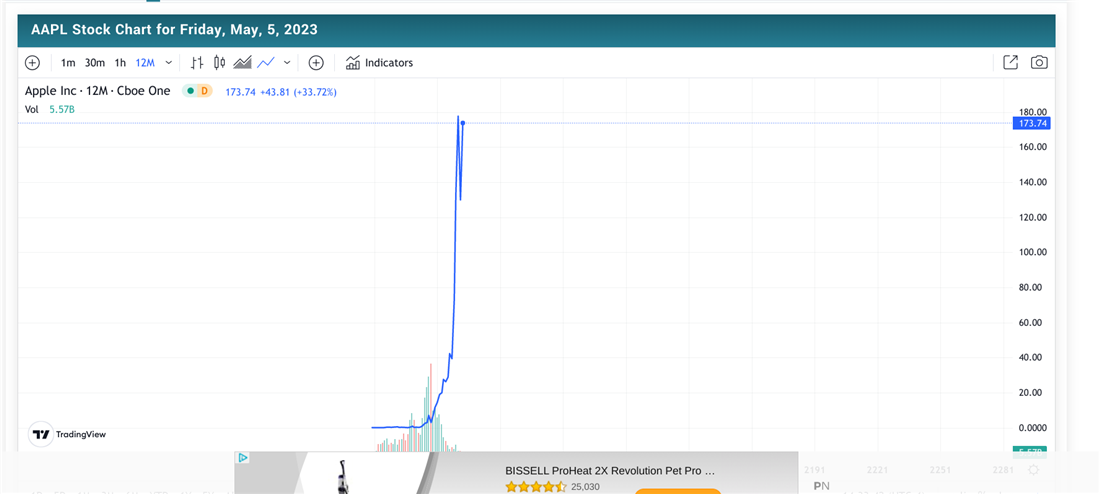
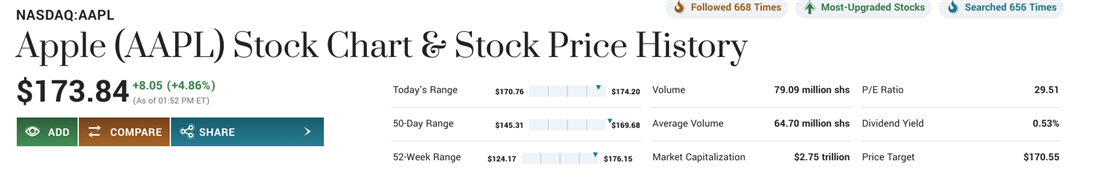
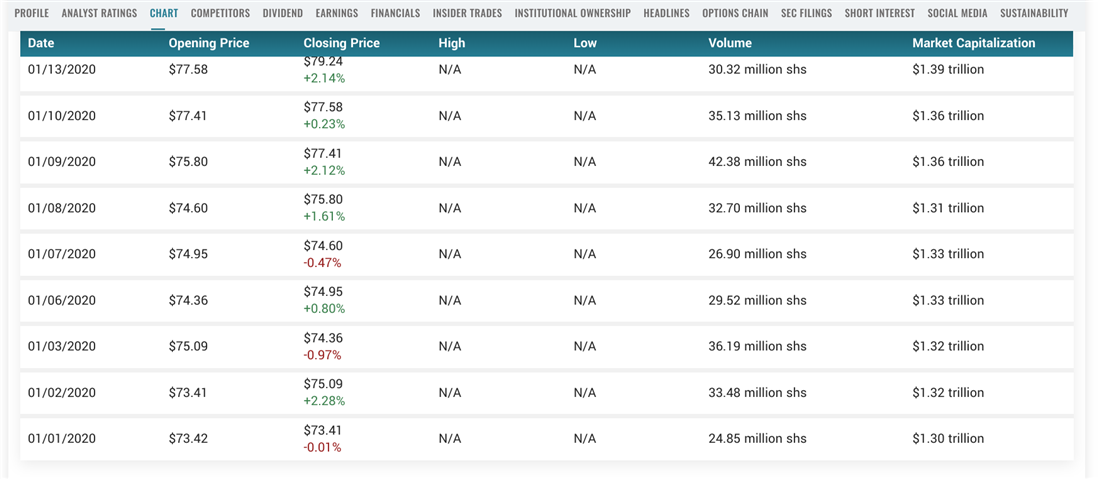
The first step in calculating a stock's growth rate is gathering the necessary data. You'll need the beginning and ending prices of the stock, as well as any dividend payments it may have made during the period. You can find these figures on the appropriate stock page on MarketBeat. For example, we'll take Apple Inc. (NASDAQ: AAPL). We can click on "charts" and put in our desired dates to see the stock price on those dates.
Next, use this data to calculate stock growth rate using the linear return method.
Linear returns are simpler to calculate and involve subtracting the beginning stock price (S1) from the ending price (S2), then dividing by S1.
Linear Return Percentage = [(S2 - S1)/S1] x 100%
Stock Growth Rates: A Key Figure for Investment Success
It would help if you also considered factors like dividends, taxes, and other market events that may affect the stock price. By understanding the different components of stock returns and learning how to calculate growth rate of a stock, you can make more informed decisions about when to buy or sell shares to maximize your investments.
FAQs
How do you calculate stock growth?
How much will $10,000 be worth in 20 years?
The amount of money that $10,000 would be worth in 20 years depends on various factors, including inflation and investment returns. If invested in stocks or mutual funds, you could see returns anywhere from five to 20% per year, depending on the investment strategy used.
To truly appreciate the future value of your savings, factor in inflation and possible returns from investments. At an inflation rate of 3.5%, the purchasing power of $10,000 in 20 years would be $19,898. With an 8% average return on investments, the value of $10,000 after 20 years — compounded annually — would be $21,589.25.
How do you turn $1,000 into $10,000 in a month?
However, investing requires research and careful consideration; making investments without those may lead to losses rather than gains. Diversifying your portfolio and understanding risk management can help to mitigate these dangers.
